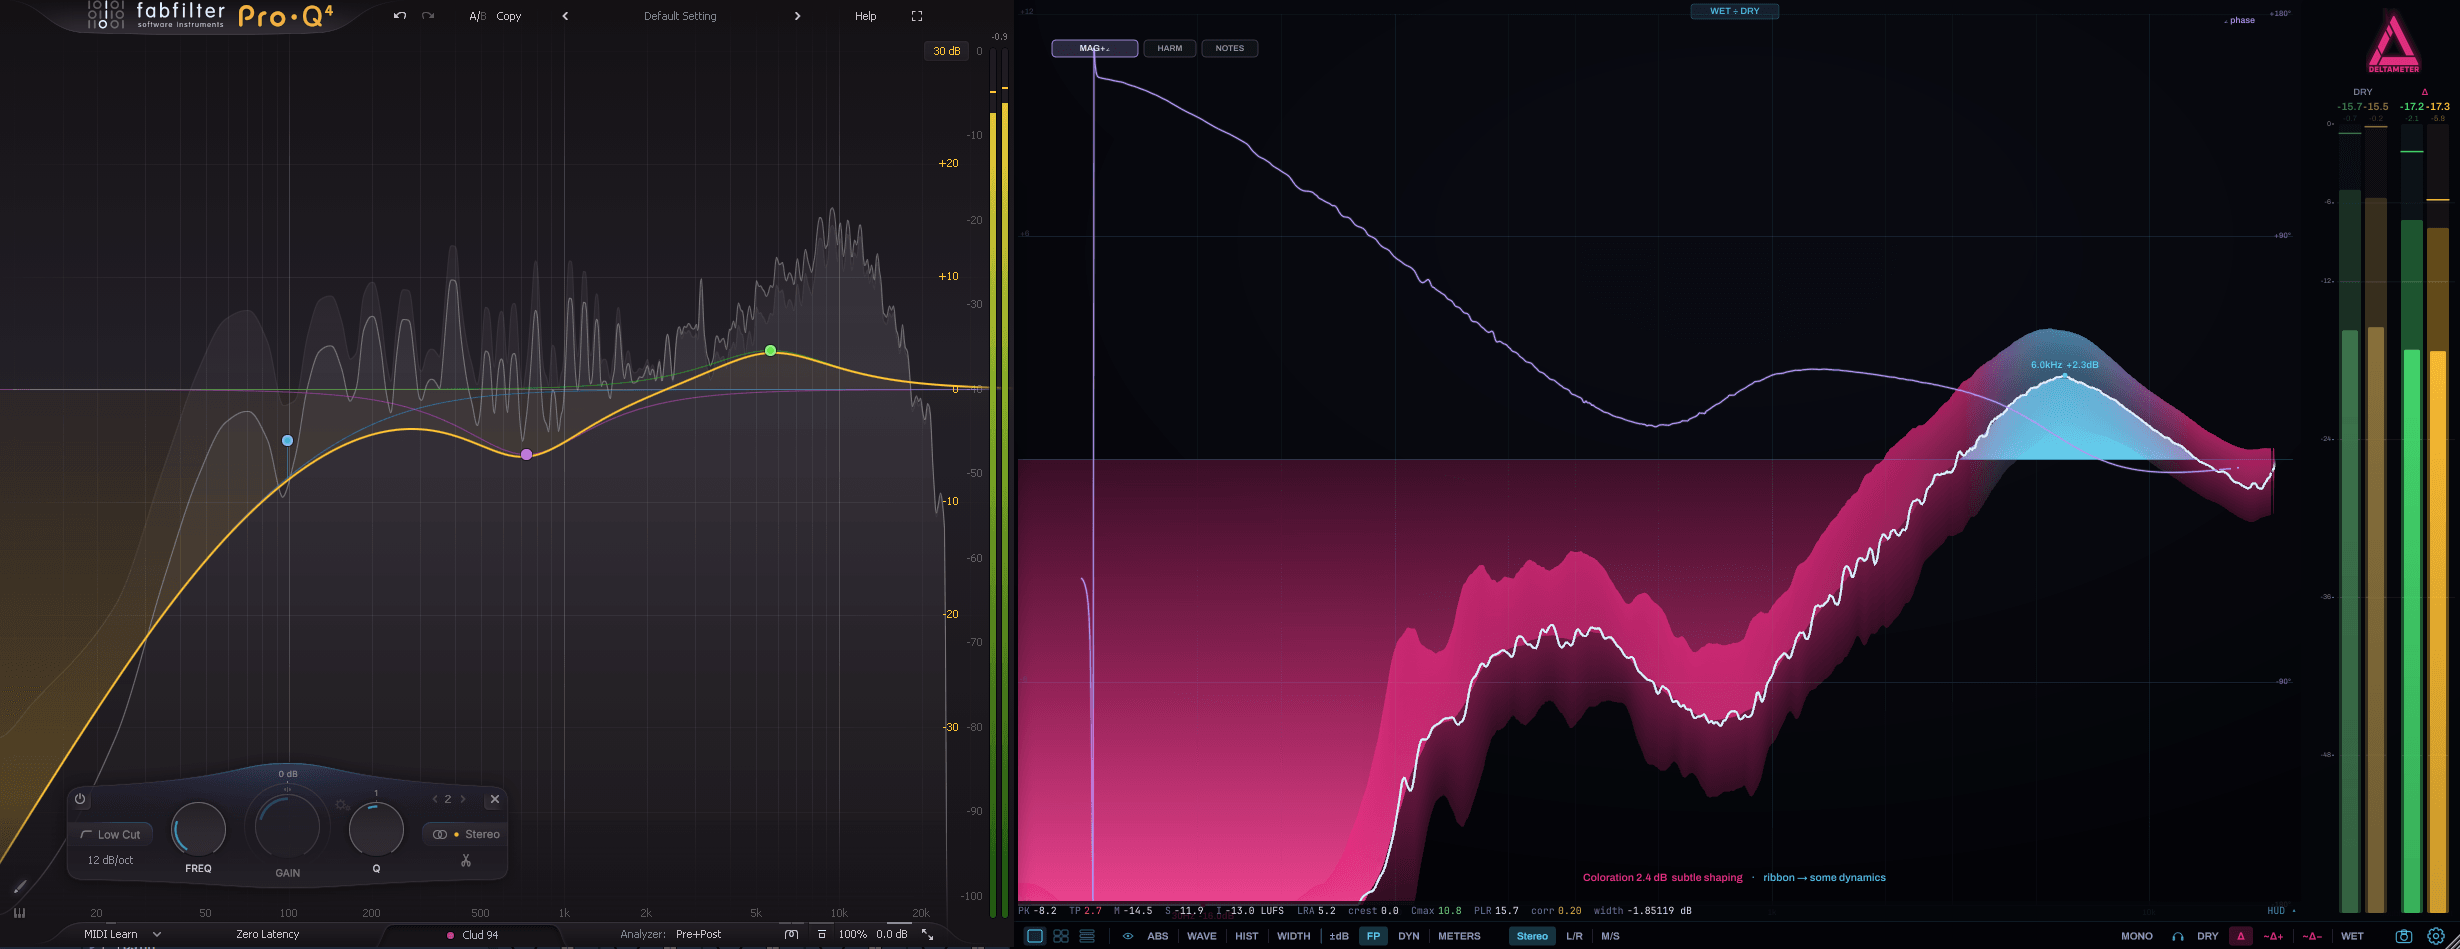
1 · What DeltaMeter is
DeltaMeter is an insert analyzer. Instead of just showing you a spectrum, it shows you what your processing actually did — by comparing the signal before your effects (the dry reference) against the signal after them (the wet output) and drawing, and letting you hear, the difference (the delta).
Drop it at the end of a chain, feed it the dry signal on its sidechain, and you can see exactly what your EQ, compressor, saturator or "transparent" limiter added, removed, or changed — per frequency, over time, across the stereo field, and across your whole project at once.
2 · Install & formats
DeltaMeter installs as VST3, CLAP, and Standalone on Windows, and additionally AU on macOS.
- Windows: the installer places the VST3 in
C:\Program Files\Common Files\VST3and the CLAP in the standard CLAP folder. Rescan plugins in your DAW. - macOS: the installer places the components in
~/Library/Audio/Plug-Ins/…
The beta installer is unsigned — Windows SmartScreen will show "Windows protected your PC" → More info → Run anyway. Expected for a beta.
3 · Quick start
The one thing you must do: give DeltaMeter a dry reference. It compares wet vs dry. The wet signal arrives automatically (it's on the insert). The dry (pre‑FX) signal must be routed into DeltaMeter's sidechain.
- Insert your processing (EQ, comp, saturation…) on a track.
- Insert DeltaMeter after all of it (last in the chain).
- Route the track's pre‑FX / dry signal to DeltaMeter's sidechain input. (How you tap a pre‑FX send differs per DAW — see your host's sidechain routing.)
- Open DeltaMeter. You now see the wet spectrum; switch the MONITOR to Δ to see/hear the difference.
Without the dry reference, the delta/transfer views have nothing to compare against. In the Standalone a synthetic dry is generated so you can explore the UI.

4 · The interface at a glance
Everything lives around one big graph. The bottom bar splits into two intent groups: 👁 VIEW (what you SEE) on the left, 🎧 MONITOR (what you HEAR) on the right.

| Area | What it does |
|---|---|
| Scope selector (far left) | Single / Quad / Multi — how many instances you see |
| 👁 VIEW | ABS · ±dB · WAVE · HIST · FP · WIDTH · DYN · METERS |
| Channel mode | Stereo · L/R · M/S (+ SOLO when L/R or M/S) |
| OL | overlay a second source |
| 🎧 MONITOR | WET · Δ · ~Δ+ · ~Δ− · DRY (+ MONO fold) |
| Δ logo (top‑right) | click = instant A/B of your last two monitored sources (or last preset / view — set in GLOBAL) |
| ⚙ cog (lower‑right) | Settings — five tabs: GLOBAL · SPECTRUM · WAVE/HIST · METERS · LICENSE |
Zen mode — the small toggle in the lower‑left hides all chrome (bottom bar, pills, logo) and leaves just the visualization and its scale, so the graph fills the whole window. It works in the single view and across the quad / multi tiles (which keep their track names). Click again to bring the controls back.
5 · Core concept: SEE vs HEAR
DeltaMeter separates what you look at from what you listen to:
- 👁 VIEW chooses the graph.
- 🎧 MONITOR chooses the source — and the analyzer follows it automatically.
Audition without moving the analyzer: Shift‑click a MONITOR source to hear it while your eyes stay on the current view (it gets a green ring; shift‑click again to stop). Re‑click the active source to flip back to the previous one (quick A/B).
Driven by audio, not the transport. The meters and scopes update whenever audio actually flows — so they work with a track armed and monitoring, and in the Standalone, not only when the host transport is rolling. On silence the scrolling scopes (WAVE / DYN / HIST) hold their last picture and the spectrum decays to the floor.
6 · Monitor sources
| Source | What it is |
|---|---|
| WET | the processed signal (post‑FX) |
| Δ | the exact difference, dry − wet — everything your chain changed |
| ~Δ+ | approximately what your chain added (new energy) |
| ~Δ− | approximately what your chain removed |
| DRY | the clean pre‑FX reference straight through |
The ~ on Δ+/Δ− signals an honest approximation (a zero‑latency filterbank split). Plain Δ is exact.
7 · The views
Two kinds of view: ABS / WAVE / HIST / WIDTH / METERS show the source you're monitoring. ±dB / FOOTPRINT / DYN / SHAPE are transfer views — they always compare wet vs dry, whatever you're monitoring.
ABS — absolute spectrum
The spectrum of the current source. Multi‑resolution FFT for fine low‑end detail.

±dB — gain‑change curve
A bipolar wet‑vs‑dry transfer: boosts above the line, cuts below. The fastest read of "what did my EQ/comp actually do."

WAVE — waveform
Time‑domain view of the source. Layout toggle (single / stacked), tempo sync (off · 1/4 · 1/2 · 1 bar · 4 bars), and a filled‑vs‑line style (Settings). It scrolls whenever audio is flowing and holds on silence. FREEZE captures ~1 s you can scrub sample‑by‑sample — and hear the grain under the playhead.
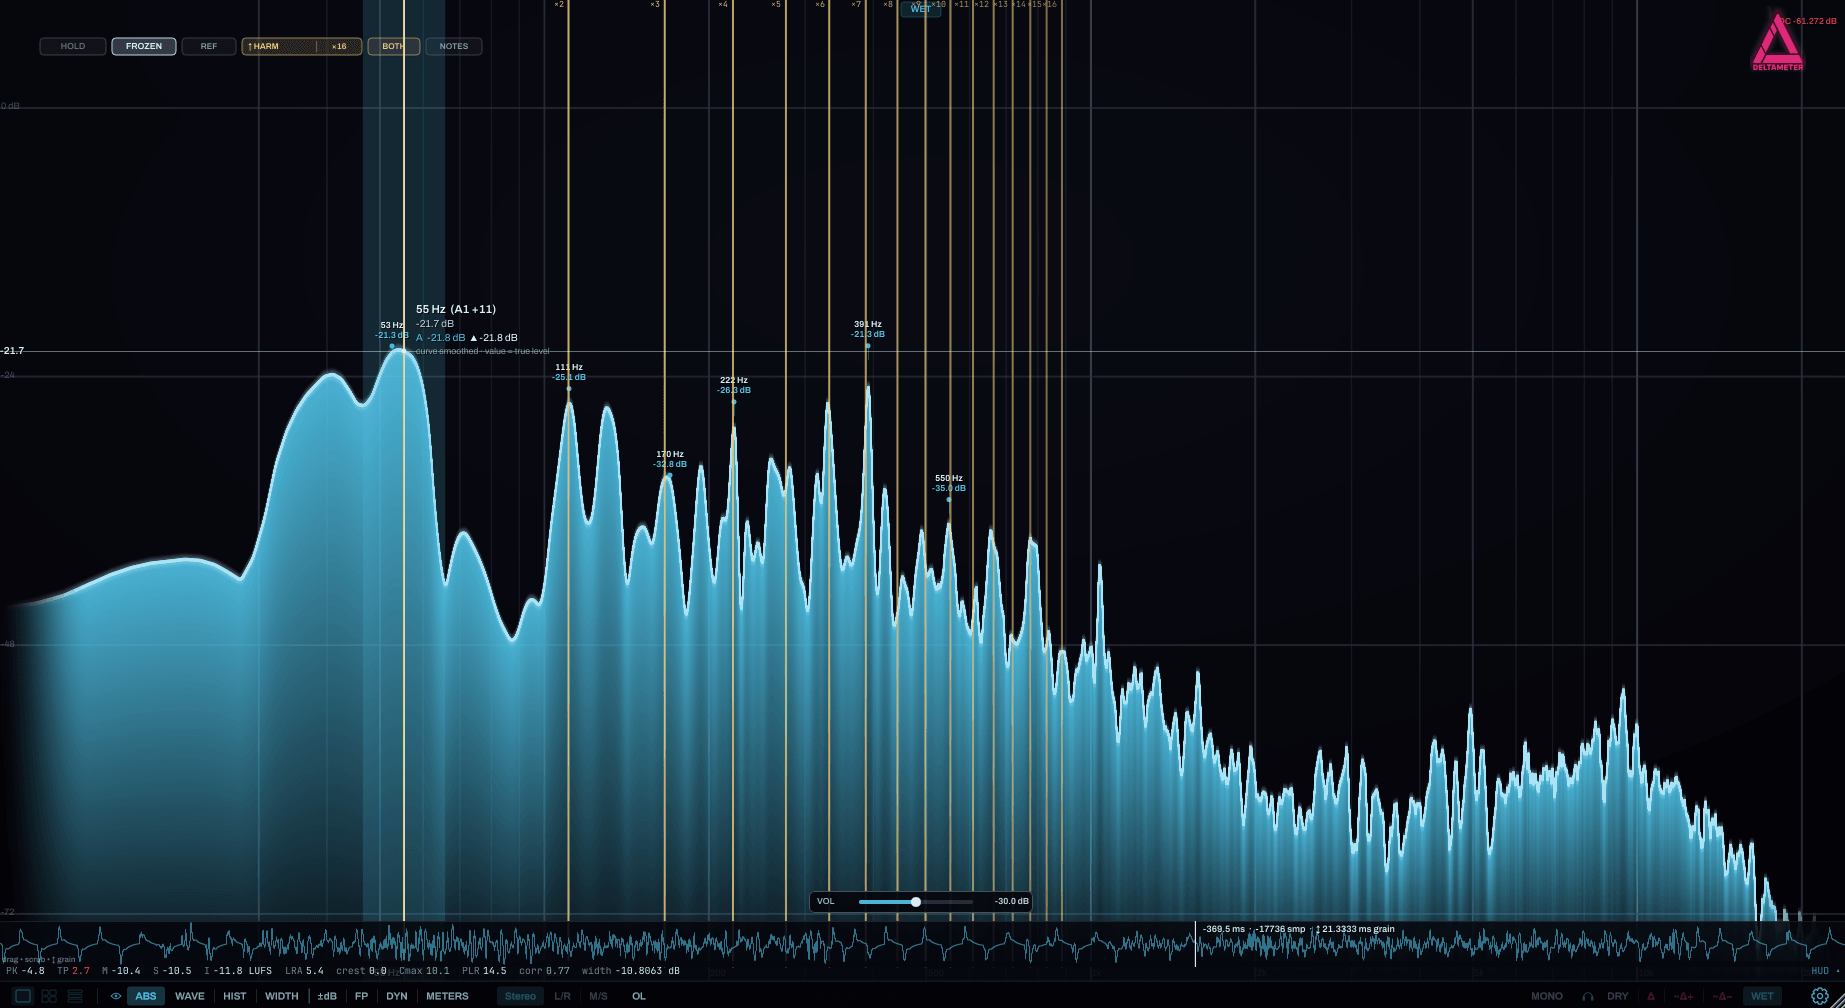
HIST — delta history spectrogram
A scrolling spectrogram of the difference over time — watch how the delta evolves.

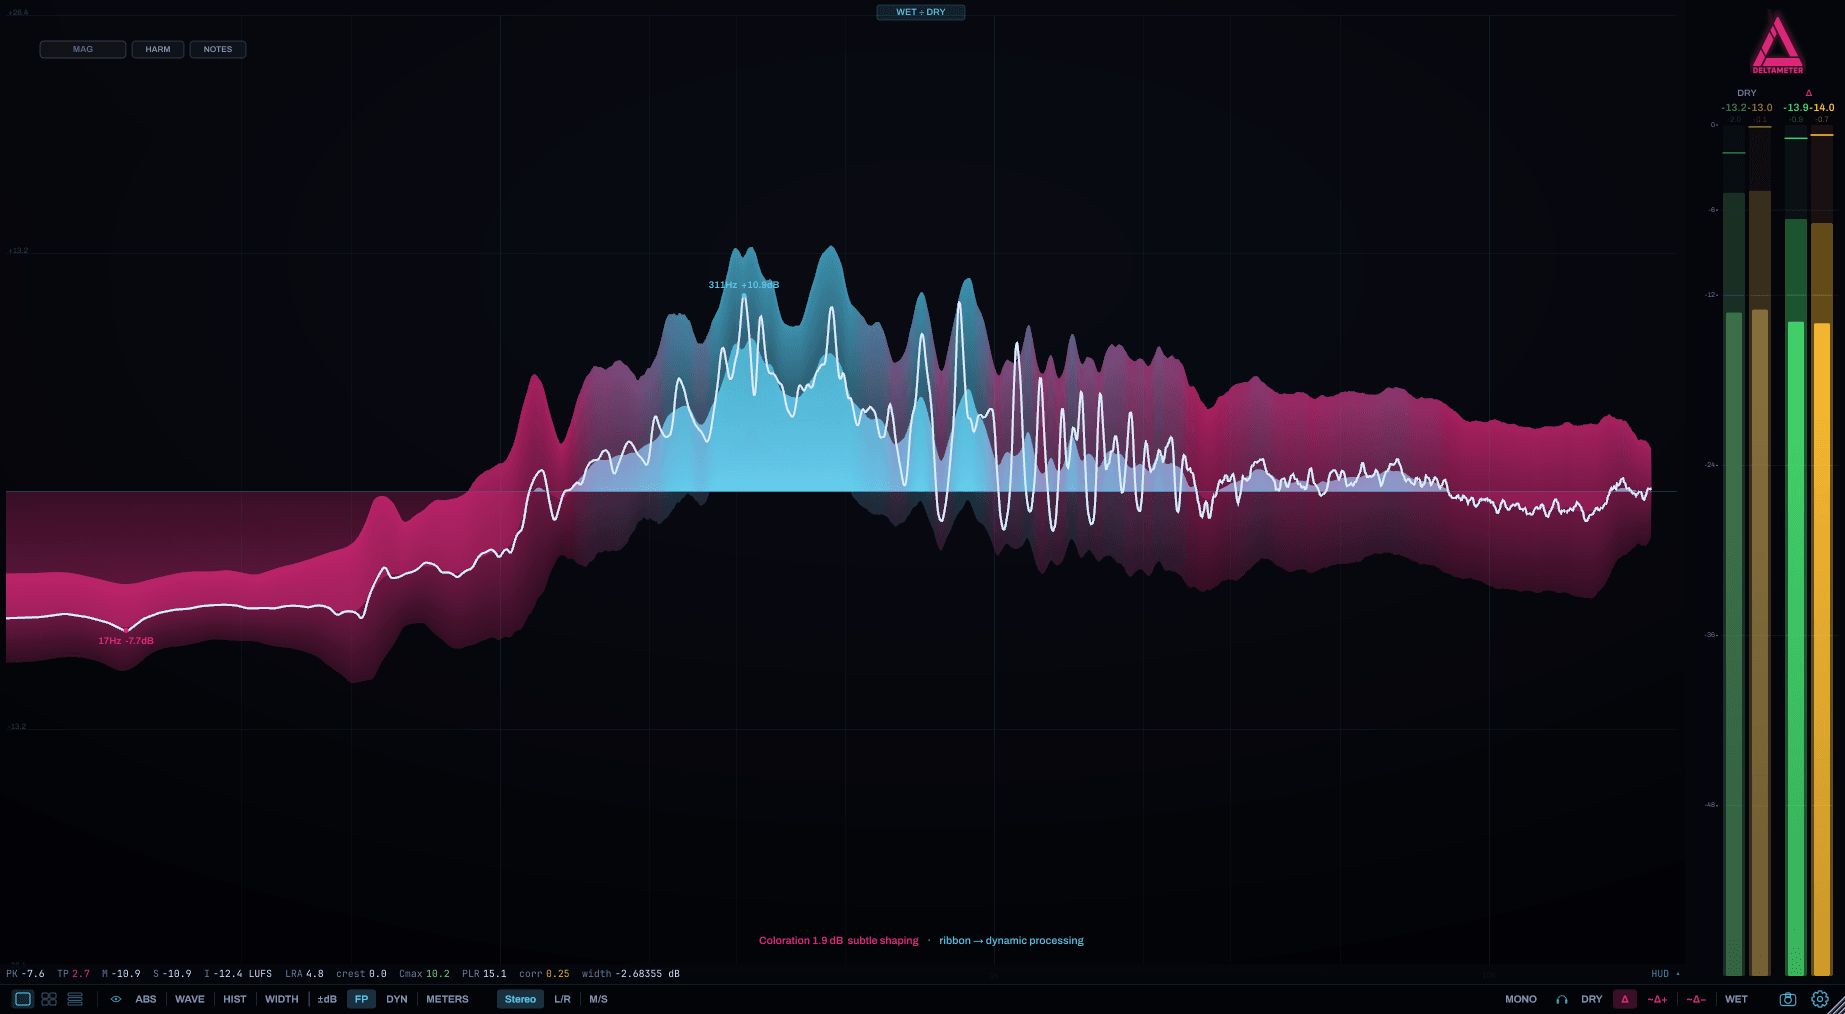
FOOTPRINT (FP) — your chain's fingerprint
A time‑averaged transfer curve with a variance ribbon: thin band = static EQ, wide band = dynamic processing. Source‑aware:
- Δ / ~Δ± → the wet‑vs‑dry transfer.
- WET / DRY → an absolute level footprint (time‑averaged shape + a drift ribbon showing how lively each band is), with an optional crest ceiling (Settings → Show crest factor in footprint).
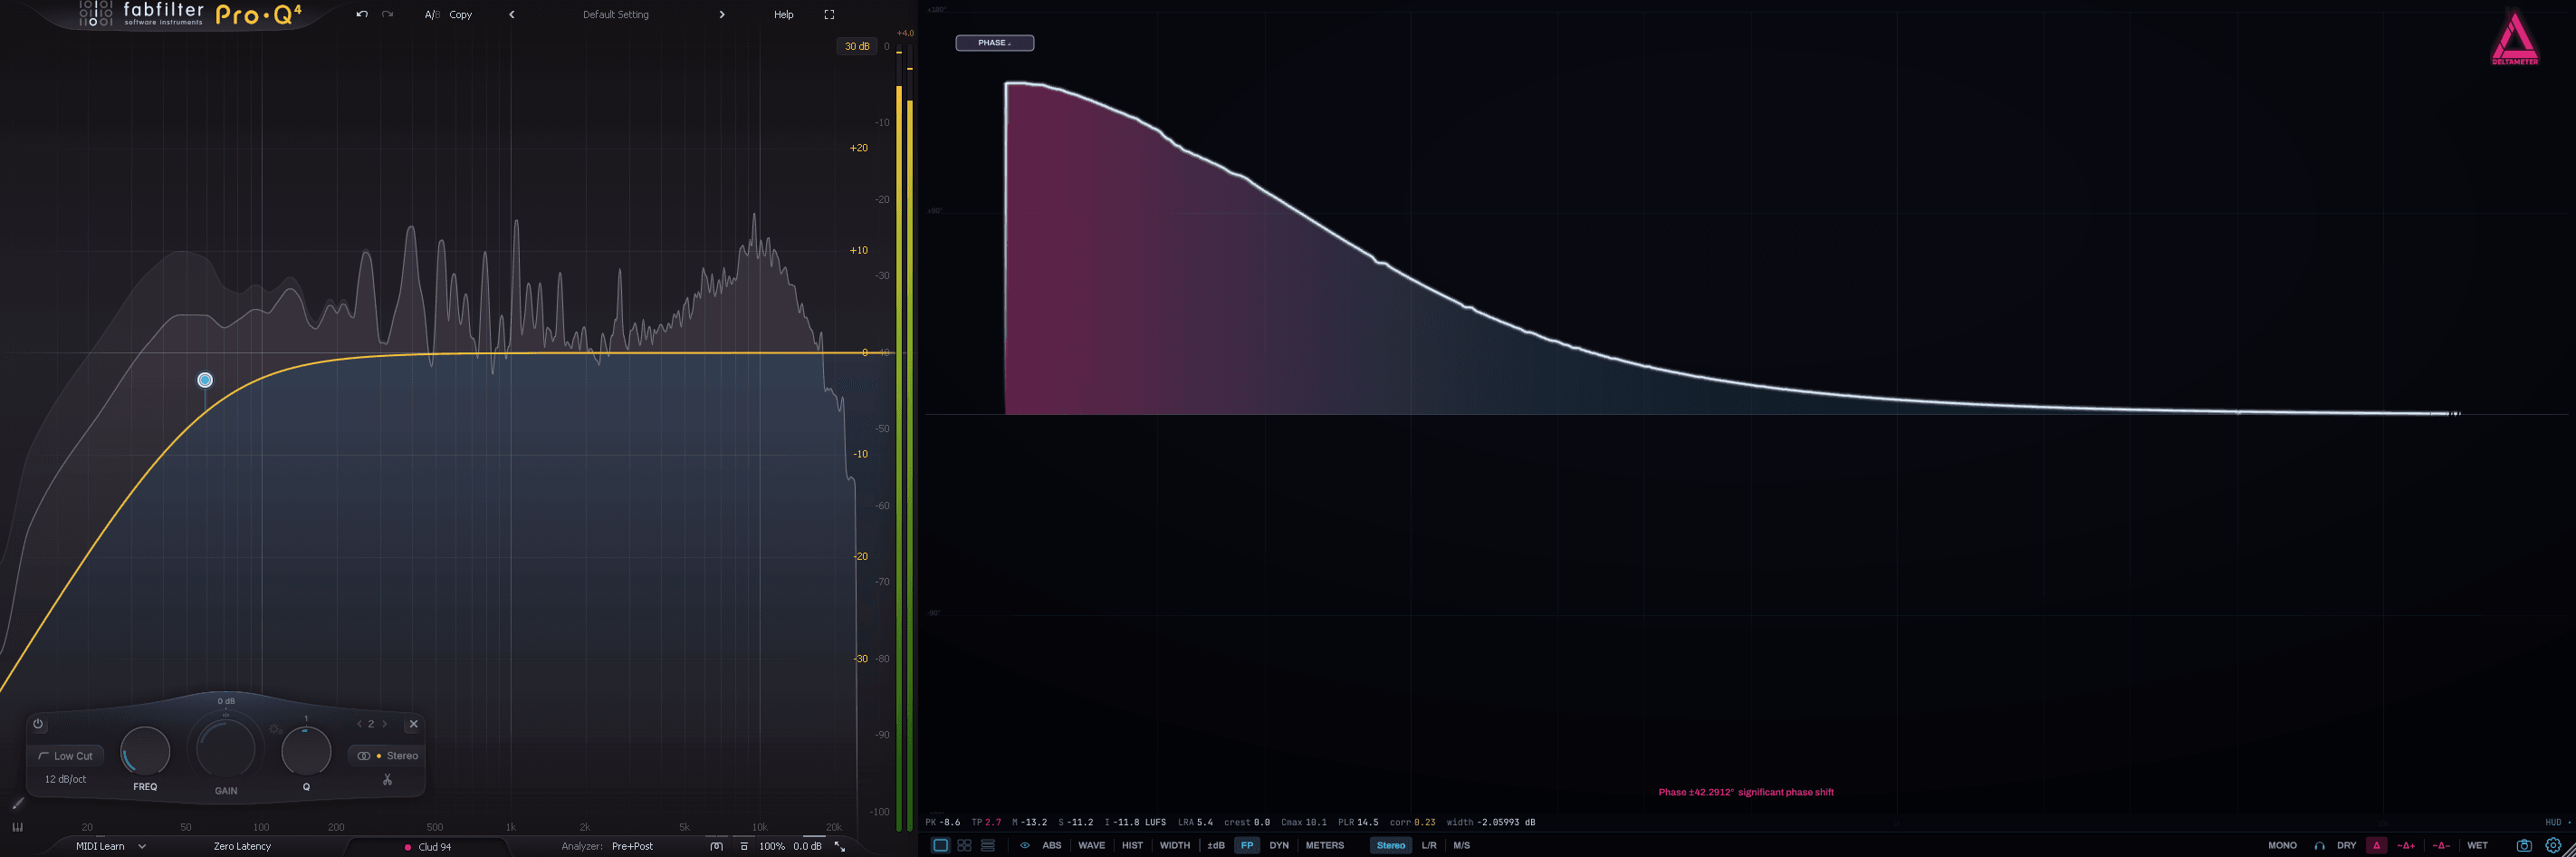
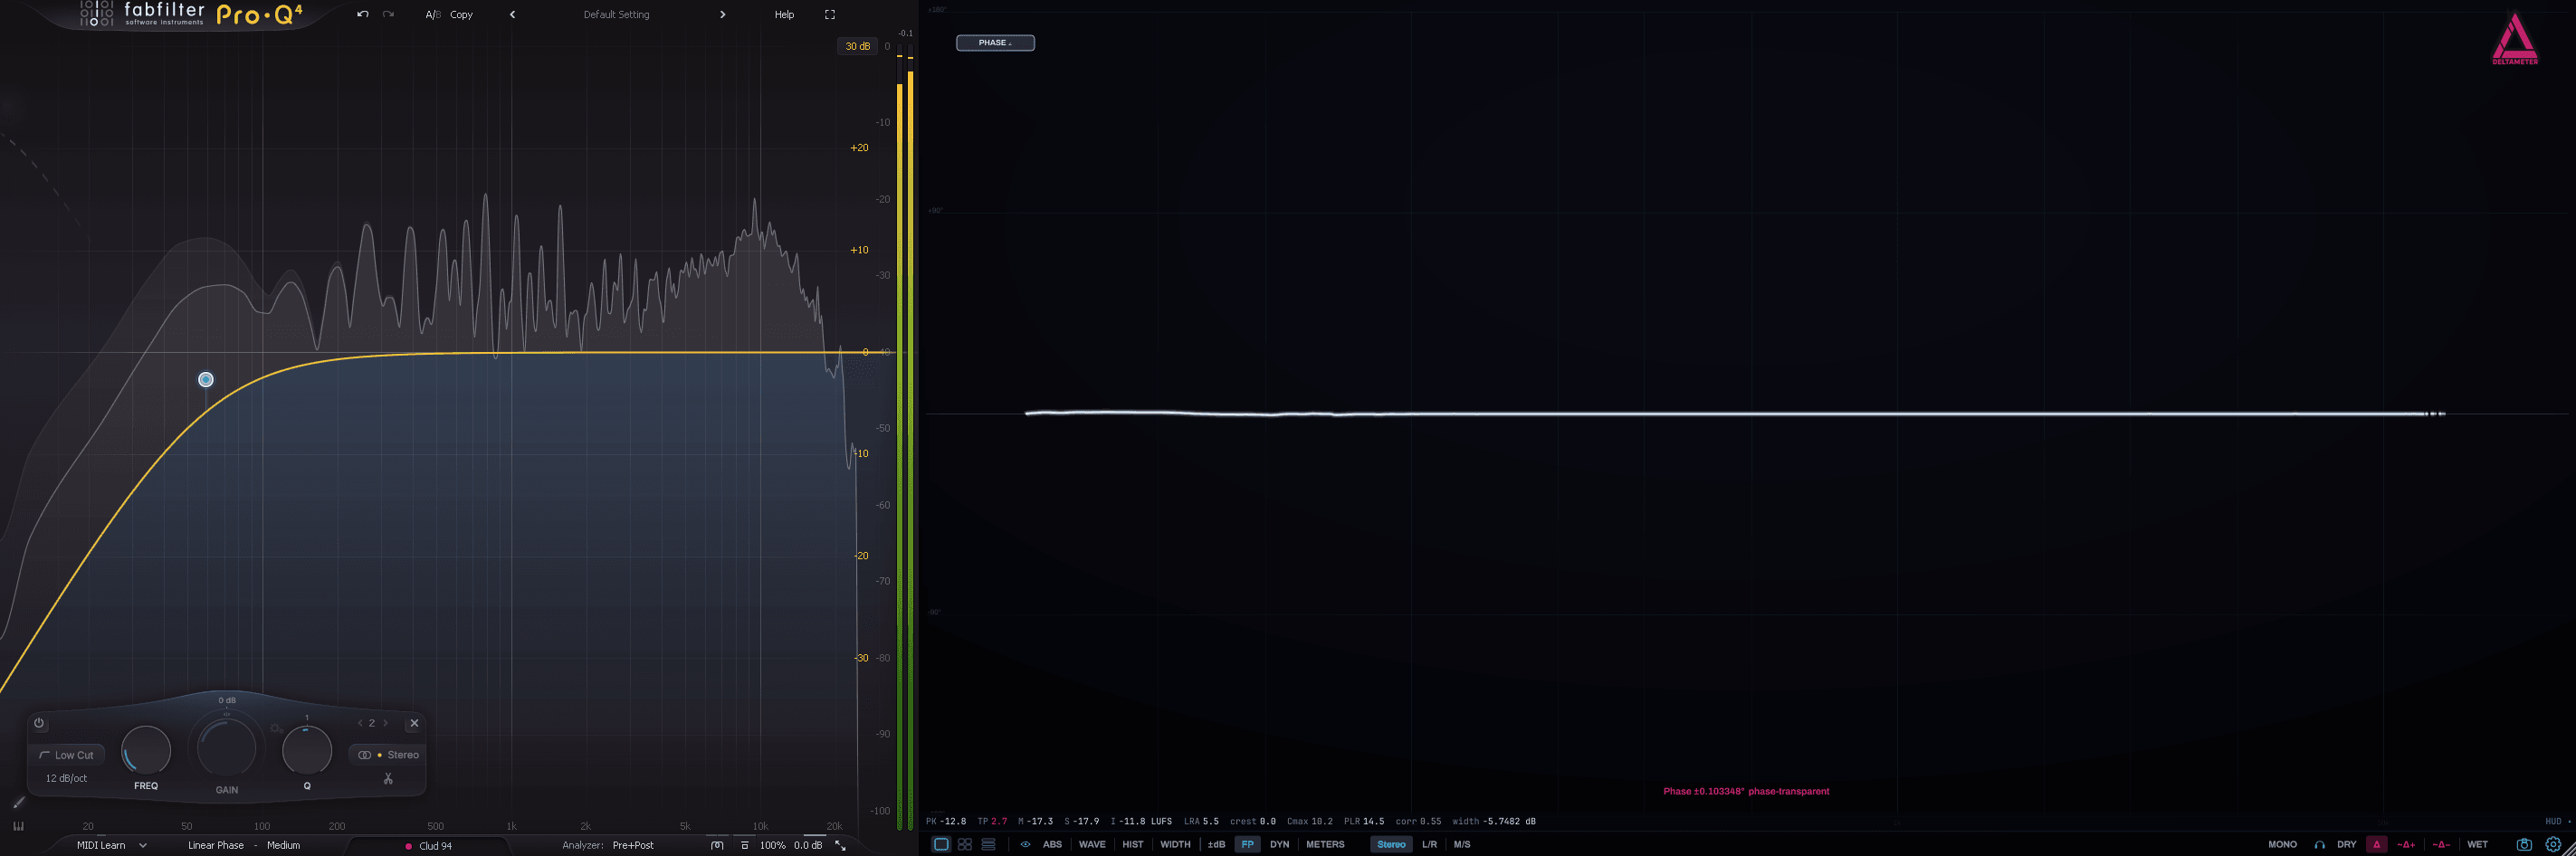
- PHASE: in transfer mode the MAG / PHASE / MAG+∠ pill reveals the chain's phase response (from the cross‑spectrum).
WIDTH — the Butterfly: stereo field per frequency
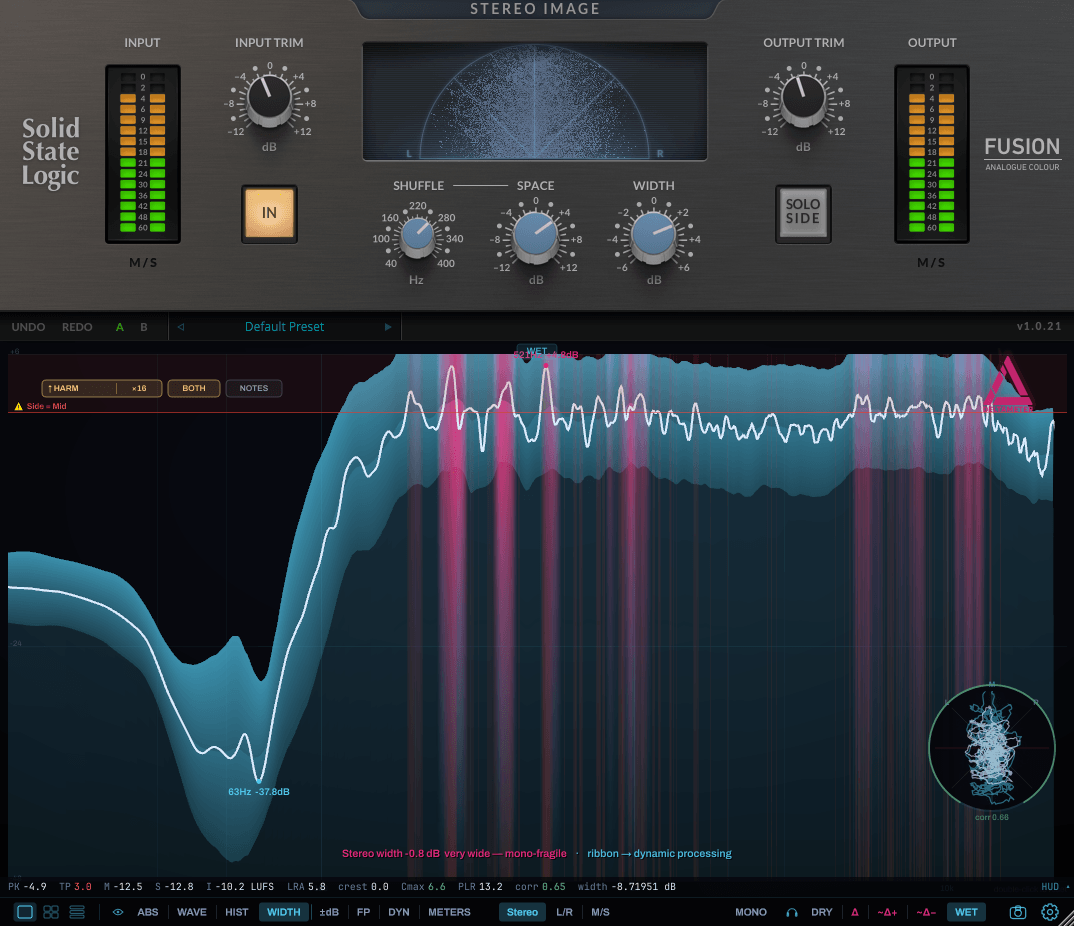
A centred, mirrored spectrum: frequency runs along the spine and each band's stereo width spreads out from it as filled wings — wide bands billow out, mono bands pinch to the spine. The colour is the warning: teal = wide & mono‑safe, turning magenta where the band collapses in mono (its Side energy cancels when the mix is summed), with a bright magenta 0 dB line marking the Side≈Mid threshold. So you see, per frequency, both how wide the image is and which bands vanish on a phone/club mono system.
A stereo‑balance ribbon rides the spine, leaning green toward LEFT or amber toward RIGHT wherever a band's energy favours one side — flat on the spine means perfectly centred. Source‑aware: WET/DRY = absolute width (a standalone stereo analyzer that works even with no dry routed); Δ/~Δ± = the change the chain made. Rotate the wings horizontal↔vertical with the ⟳ toggle. A goniometer sits alongside (lower‑right).
Two looks — curve and bars — driven by the spectrum's setting. The Butterfly follows Settings → Spectrum: with the smooth curve selected you get the flowing silhouette; with octave bands selected (1/1 … 1/24 oct) the wings render as RTA‑style band bars at that exact density. One setting, one visual language across the whole plugin — ABS, WIDTH, single view and every Multi/Quad tile all agree.
DYN — dynamics / gain reduction over time
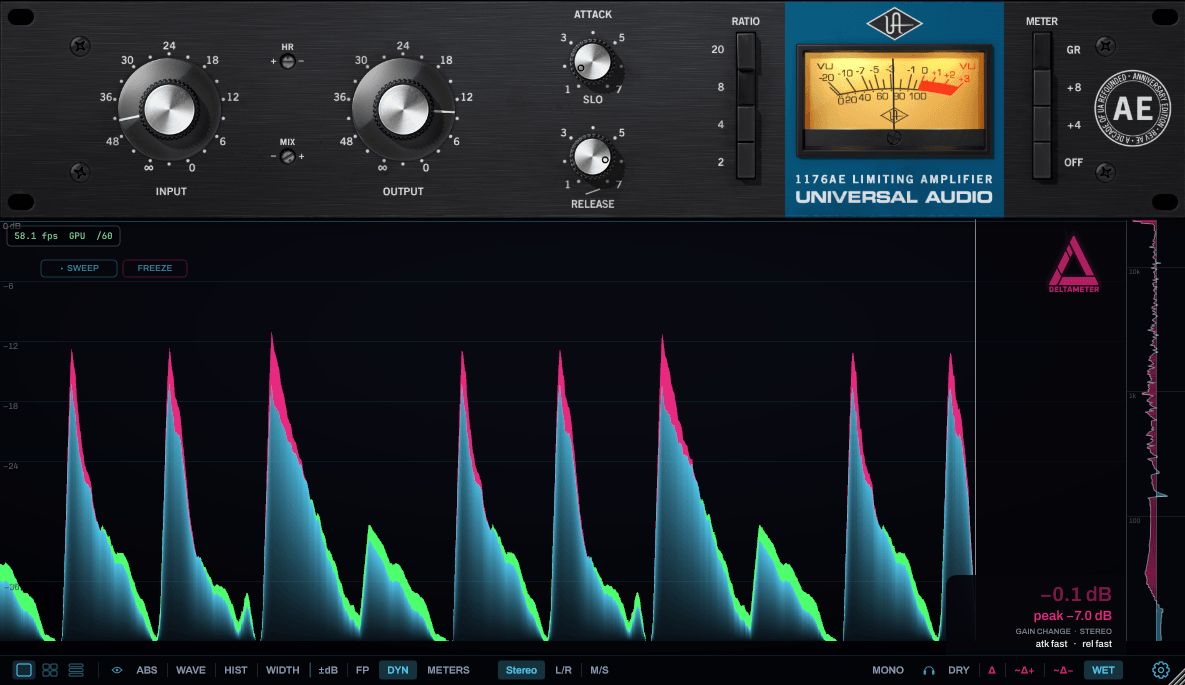
Reads a compressor's real attack and release off the wet‑vs‑dry delta — the gain change your dynamics applied to this material, over time, not the numbers on the dial. The dry signal is the body; the signed band between dry and wet shows the change — magenta = removed/cut, neon green = added/boost — so the teal still showing beneath the magenta is exactly what survived. How fast the band bites is the attack; how it lets go is the release.
- ±dB rail (right edge) — a vertical mini ±dB spectrum showing the same gain change resolved by frequency. Hover the rail to read the exact frequency.
- FOLLOW ⇄ SWEEP — continuous scroll that tracks the live edge, or an anchored playhead the image sweeps under.
- FREEZE — hold the picture still to inspect or measure it (see the ruler).
- Drag the left edge to zoom into a fast attack; double‑click to reset.
- Clip marks (0 dB ceiling) — thin red strokes pinned at the very top when the wet flat‑tops: they're derived from the wet's near‑full‑scale sample density (the same clip metric as the meters), so they mean the output is slamming the digital ceiling right there — brightness = how hard. Deliberately not a band hanging from the top: that silhouette means "gain‑reduction curtain" in every limiter view, and these marks mean clipping, a level fact — they show even with the distortion overlay off.
- Distortion lane (bottom) — with Distortion heat on (Settings), a fiery band rises from the floor tracking added non‑linearity over time, scrolling in lockstep with the gain change it sits under.
- Readout (bottom‑left) — four directly measured numbers: the live gain change, the deepest held cut as rms and peak, and the chain's makeup. How to read them ↓
Honest by design — the readout. Everything here is measured off this material, nothing is estimated. The big number is the gain change right now (wet vs dry RMS at the newest column — it always matches the band you see). rms holds the deepest cut in level terms — how much loudness the chain takes; it's the number to dial your makeup against. peak holds the same but measured on the peak envelopes — what a limiter's own GR meter shows. The spread between them is itself diagnostic: rms ≈ peak means broadband level compression; peak ≫ rms means transient shaving — the chain is clipping crests, not riding loudness. Both hold their deepest value and relax at ~9 dB/s, so they're directly comparable. makeup is the chain's measured static gain — the gain it applies when it isn't reducing, read from the trace's rest level. A brick‑wall limiter that never rests has no rest to find, so makeup honestly shows "—" rather than a guess.
SHAPE — the transfer curve, drawn by your own music
Every sample is plotted as a point: x = the dry sample going in, y = the wet sample coming out, brightness = how often. That cloud of dots is your chain's real waveshaper curve, traced from your material — at 48 kHz it's forty‑eight thousand measurements per second falling onto phosphor. A saturator has no memory and no timing; it's just a rule applied to every sample, and this view draws the rule itself. The teal diagonal is unity: a wire lands exactly on it. Distortion algorithms you've only ever heard become visually distinct signatures: soft sine = a smooth S · hard clip = flat corners · analog = rounded and asymmetric · a wavefolder folds back on itself · tape hysteresis opens into a loop · a limiter fans into lines through the centre.
Reading the picture — three independent measurements at a glance:
- The core's shape = the static transfer. Straight to the corners = no level bending; an S = saturation; a flat shoulder = the "crush" zone where dynamics stop existing.
- The cloud's width = memory. A memoryless waveshaper draws razor‑thin; frequency‑dependent phase, hysteresis or multiband behaviour smears the trace into a halo no static curve can produce. A transformer emulation wears its veil here — and a plugin that's "just a curve with a vintage GUI" is exposed in one look.
- Where along the diagonal the cloud sits = at which levels the device acts.
- Readout (bottom‑left) — four directly measured character numbers: gain (dB) = the best straight line through the data, the linear part — catches hidden makeup instantly; bend (%) = how far the median curves away from that line — the static nonlinearity; cloud (%) = the spread of the dots around the median — memory/phase, a transformer's whole character lives here; asym (%) = how unequal top and bottom halves are — the even‑harmonic ("warmth") generator. Together: how loud, how bent, how smeared, how warm.
- Drag the left edge to set the phosphor decay (0.15–6 s; double‑click resets 0.9 s): long = a dense, painterly cloud; short = a snappy trace that follows your drive knob in real time. The physics stays honest at every setting — only real samples add light; when audio stops, the tube cools to black.
- Double‑click the plot to clear the phosphor — a fresh accumulation right after a tweak.
- Floor glow — the ember rising from the bottom edge tracks the chain's measured nonlinear fraction (1 − coherence): the harder the distortion, the warmer the room.
- Multi View / Quad — SHAPE is a tile like any other: pin ABS on one tile and SHAPE on its neighbour, same track. (Cross‑process tiles show local tracks for now.)
The spoon rule. SHAPE is built for the distortion stage: wrap DeltaMeter around just the saturator and the curve is crisp. Around a full chain, EQ and phase rotation smear the trace into a wide cloud — that width is still honest total nonlinearity, but the curve itself blurs. A spoon can hardly eat spaghetti; for soup it's perfect. Also note: a steady test tone reads as fully coherent (a fixed filter could always explain one unchanging signal) — feed it moving material and the truth comes out. Needs the dry reference on the sidechain, like every transfer view.

METERS — full loudness dashboard
A full‑screen professional loudness bridge — distinct from the right‑rail mini meter (§12). Per‑channel L / R / Mid / Side bars each with a duller dry ghost, peak‑hold caps, a target line with tolerance band, and the full BS.1770 / EBU R128 family: Momentary, Short‑term, Integrated LUFS, LRA, True Peak. Plus crest, PLR/PSR, correlation, and a loudness‑history graph. LOUDNESS ⇄ LEVEL face toggle and a large numeric readout.

7b · Measurement ruler (Alt‑drag)
A universal two‑point tool: hold Alt and drag between any two points on the graph to read the exact distance. The ruler is view‑aware:
| View | What the ruler reads |
|---|---|
| ABS · ±dB | Δfrequency (in octaves) + ΔdB between the two points |
| FP · WIDTH | ΔdB + octaves + slope (dB/oct) — read a filter's roll‑off off the curve |
| DYN | Δtime + ΔdB + slope (dB/ms) — measure a compressor's attack or release directly |
| WAVE (frozen) | Δtime + ΔdB + slope — a transient's rise time, or a tail's decay |
| HIST | the frequency span between the two points, in octaves |
On scrolling views the image freezes while you measure: in DYN hit FREEZE first; WAVE uses its own freeze; HIST auto‑pins as you drag. Right‑click clears the ruler.

8 · Frequency, harmonic & chord‑tone isolation
DeltaMeter doesn't just show a band — it lets you solo or remove it, and its harmonics or chord tones, and hear the result. Available in ABS · ±dB · WIDTH · FOOTPRINT · HIST.
Isolate a band
- Click the graph for a momentary read/solo of a band (frequency + level at a crosshair).
- ⌘/Ctrl‑click to latch it (stays until right‑click).
- Drag up/down while held to change the band's Q (width).
- Shift‑click to notch instead (hear everything except the band).
HARM — the harmonic series gold
With a band latched, a HARM pill appears. The left zone cycles the mode (— → ↑ → ↓ → ↕); the right zone ×N sets how far up the series (click ± or drag). A BOTH / EVEN / ODD pill isolates even (2·4·6, "warm") or odd (1·3·5, reedy) harmonics — the tube‑vs‑transistor check. The lit gold lines are a band‑pass comb — you hear only the harmonics. Mouse‑wheel over the band arms → grows → disarms.

NOTES — chord tones rainbow
A NOTES pill reveals interval toggles — 2 · 3 · 4 · 5 · 6 · 7 — plus a MAJ / MIN / BOTH quality toggle. Each interval lights the note above the root in its own colour (2nd red · 3rd orange · 4th yellow · 5th green · 6th sky · 7th violet) and tiles up the octaves. Use it to identify chords: toggle 3·5·7·2, set quality, read which tones have energy.

Shift = remove: hold Shift and the comb cascades notches at the whole series/chord — hear everything except it. Everything here also works while a freeze/grain is scrubbed.
9 · Reference curve (REF)
In the WET spectrum, the REF pill overlays a target tonal‑balance curve: Pink (−3 dB/oct), −4.5 dB/oct (darker), −1.5 dB/oct (brighter), or Capture current (snapshot a commercial track you trust and match your mix to its curve). Drawn as a gold line, normalized to your level each frame — you compare shape, not loudness.

10 · Overlay another track (OL)
OL lays a second signal over the one you're monitoring. Toggle OL and pick a source from the "vs ‹source›" dropdown — the sidechain, or any other DeltaMeter instance in your project, by track name.
- Spectrum (ABS): a ghosted reference curve in the source's track colour.
- WAVE: the source waveform, channel‑aware, timeline‑aligned. A small offset trim (±100 ms) dials out residual host PDC, remembered per source. Freeze + scrub both traces to read the exact gap.
- HIST: the source's spectrogram beside yours.
Great for kick‑vs‑bass phase, DI vs reamp, vocal vs double, or matching one track's tone or stereo image to another.

11 · See your whole project — Single / Quad / Multi
The headline feature: every DeltaMeter instance can be seen at once.
- Single — just this instance.
- Quad — a 2×2 grid: four tracks side by side, or four views of one track (each cell picks its own: ABS · ±dB · WAVE · HIST · METERS · WIDTH · MTR GRAPH).
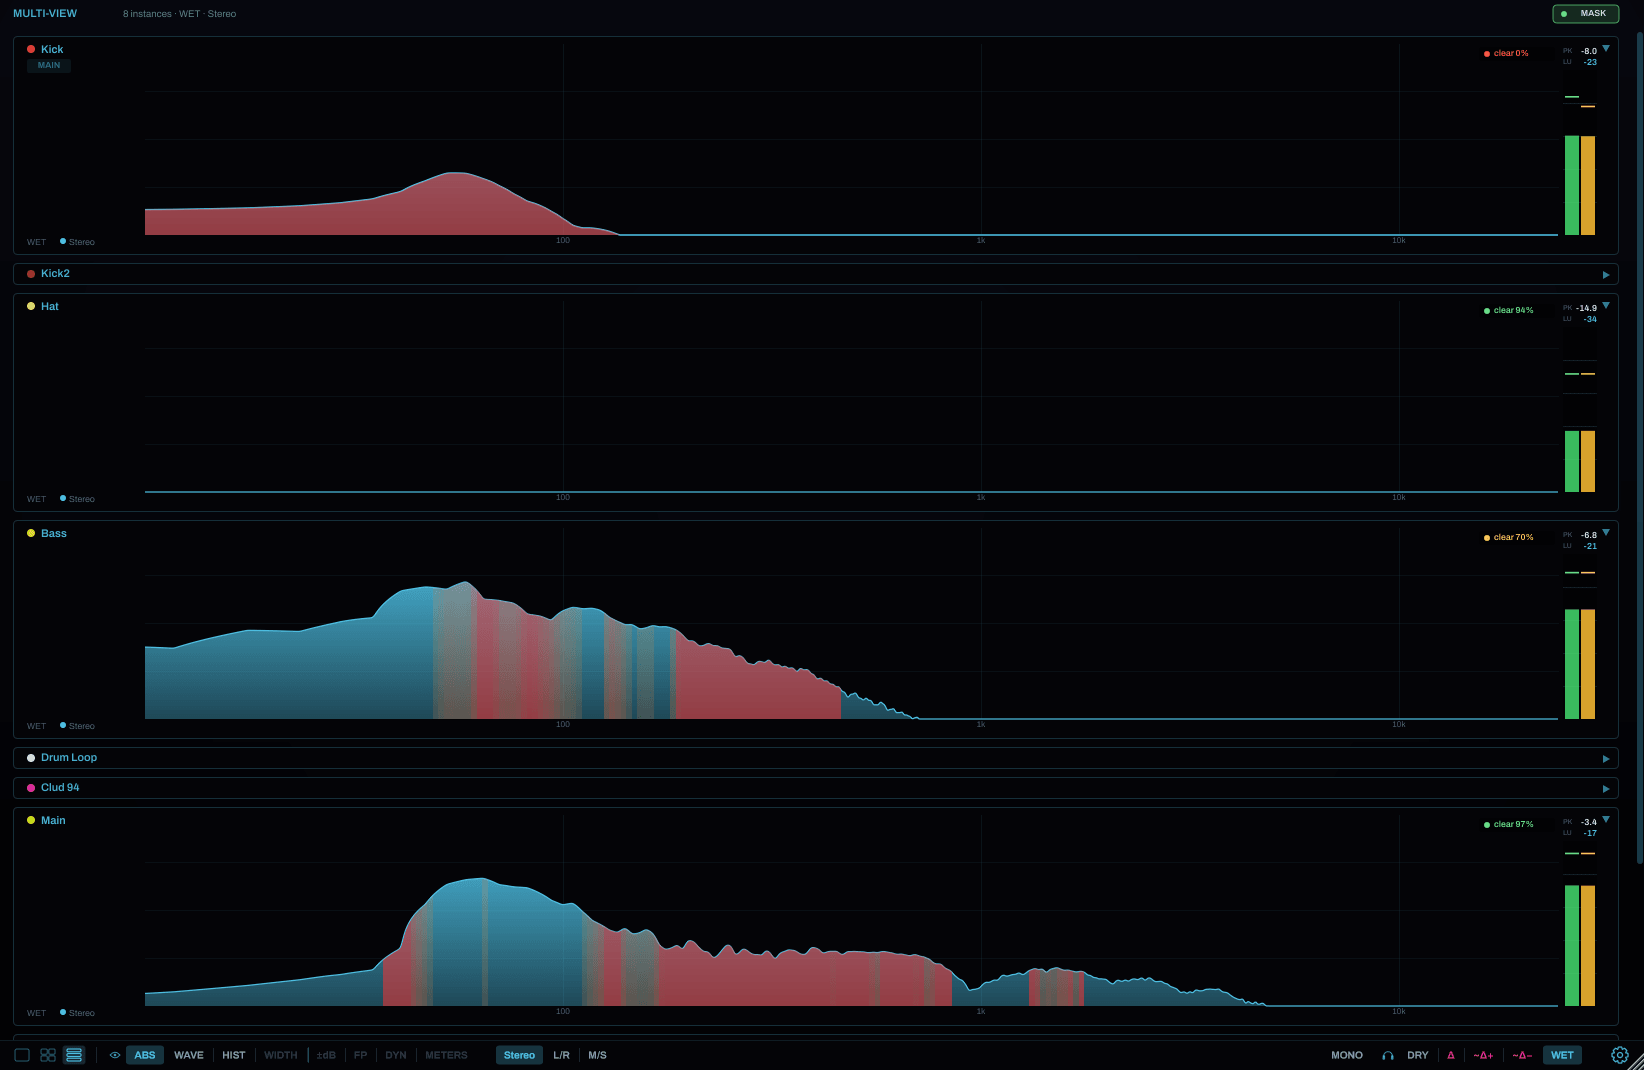
- Multi — every DeltaMeter in your project as a live, scrollable wall of tiles. Collapse/expand, rename, drag to reorder; the leader broadcasts its view to the rest — or pin any tile to its own view and channel with the switcher in its lower‑left corner. Tiles inherit host track names/colours.
- Masking (Multi → MASK): each tile washes the bands where it's buried by the rest of the mix, with a per‑track clarity %.
No bussing — drop DeltaMeter on as many tracks as you like; switch one to Multi and they find each other.
Mute & solo from the wall — M / S / BUS
Every tile carries M (mute) and S (solo) under its mini meter — mix-style listening control without leaving the wall. M silences that track; S leaves only the soloed track audible. Both ramp click-free and clear automatically when you leave the Multi view — nothing is ever left stranded muted.
How it works (and why): a plugin cannot press your DAW's mixer buttons — no DAW exposes that. So DeltaMeter does the next best thing: each instance can mute the audio at its own insert point, and the Multi View coordinates all of them. Mute = that one instance goes silent. Solo = every other DeltaMeter mutes its track.
The BUS flag: a soloed track usually routes through busses on its way out (group bus → master). If the DeltaMeter sitting on a bus muted itself during solo, it would kill the very signal you soloed. So bus tiles are solo-safe: they never mute on solo — and since every other track is muted, the only thing flowing through them is the soloed track, with the bus chain (glue compressor, bus EQ) still running. You hear the solo as it sits in the mix. Tracks named like busses (Master, Main, Drum Bus, FX Group…) are flagged automatically; the BUS chip next to the tile name (visible on hover) flags or un-flags any track — your click always beats the guess. An explicit M on a bus still mutes it.
- Only tracks with a DeltaMeter participate. A track without an instance can't be muted by us — under solo it keeps sounding. For mixer-grade solo across the whole project, give every track (and every bus) an instance.
- We can't see your routing. If a bus doesn't have a bus-like name (say, a group just called "Drums"), flag it once via its BUS chip — otherwise soloing anything routed through it gets cut by that bus's instance. One click, remembered with the project.
Build your own dashboard — ALL ⇄ CUSTOM
The Multi wall has two faces (toggle in the header). ALL is the zero‑config magic: one tile per instance, automatically. CUSTOM starts as a blank canvas with a + — add any track, in any view, as many times as you like: four tiles of your master (spectrum, wave, meters graph, width) next to the two tracks you're actually mixing. Each tile keeps its own view, channel, size and collapse state.
- Add — click the + (or the trailing add tile row) → pick a track, then its view. Add ALL tracks seeds the canvas.
- Remove — the × beside a tile's name pill; an UNDO toast catches slips. Nothing is lost — the instance keeps running, re‑add any time.
- Leaner sessions — tracks you leave out stop computing their display analysis entirely; a focused dashboard is lighter than the full wall.
Multi View snapshots — pills 1‑10
Ten small pills in the Multi header store complete Multi View scenes — layout, faces, every tile's view/channel, sizes, collapse states, masking, the whole CUSTOM dashboard. Saved with your session and rock‑solid across project reloads.
- Ghost pill — click to save the current scene (double‑blink confirms).
- Lit pill — click to recall (pulse). Hold ~1 s to overwrite — a charge‑ring fills while you hold, so it can't happen by accident.
- Right‑click clears a slot. A tiny amber dot on the active pill means you've tweaked the layout since saving it.
Snapshot 1 = the whole mix · snapshot 2 = your low‑end wall · snapshot 3 = master QC. One click apart.
Adaptive performance — it protects your session
A heavy Multi View on a modest machine can't be allowed to stall your DAW. DeltaMeter watches its own UI health — including the sneaky case where the display keeps drawing but stops reacting to your mouse — and steps itself down until it runs smoothly again: 30 fps cap → low‑power mode → collapse tiles → leave Multi View → pause the display. Each step announces itself with a small toast, recovery is automatic once there's headroom, your settings are never rewritten, and audio is never touched. (Status line in Settings → Performance; note that Eco mode and 60 fps are mutually exclusive — Eco always caps at 30.)
12 · Loudness meter
Enable in Settings → METERS → Loudness meter (the right‑rail mini meter; for the full‑screen dashboard see the METERS view, §7). It docks in its own column so the graph keeps its full plotting width. Per‑channel bars, peak‑hold caps, clip‑aware colouring (amber within 1 dB of 0, red at/over 0 dBFS). Configure in the METERS tab:
- Metric: Momentary · Short‑term · Integrated LUFS (the default) · RMS · LUFS+3.
- Rail metric: the always‑on right‑rail's per‑channel metric, set independently of the program metric (Follow · Momentary · Short · Integrated · RMS · LUFS+3). Because Integrated is a mono measure the L/R bars would otherwise read identical — give the rail its own (e.g. Momentary or RMS) to see each channel move.
- Show dry: a duller dry meter beside the wet — loudness before vs after the chain.
- Target + platform presets: a target line with a ±1 LU tolerance band and a ✓ ON TARGET / ▲ LOUD / ▼ QUIET badge. Platform presets set the target and the true‑peak ceiling in one click — Spotify, Apple Music, YouTube, Tidal, Amazon Music, Deezer, SoundCloud, EBU R128, ATSC A/85 and Club / CD.
- True‑peak ceiling (dBTP, default −1) — a marker on the meter that flags any inter‑sample peak over it.
- LU relative to target — show the LUFS‑family numbers relative to the target ("LU", with 0 = on target).
- Calm readouts — switch every number to white/ink so the readouts stop shouting; only genuine status (over‑target / clip / true‑peak) keeps a light‑magenta accent. Bars stay coloured.
- Show scale, a docked Big readout, and Wall mode (full‑width bars + scaled‑up text) for across‑the‑room reading.
While a freeze grain is looping (WAVE/ABS/DYN), the meters hold their values so a frozen reading stays steady.

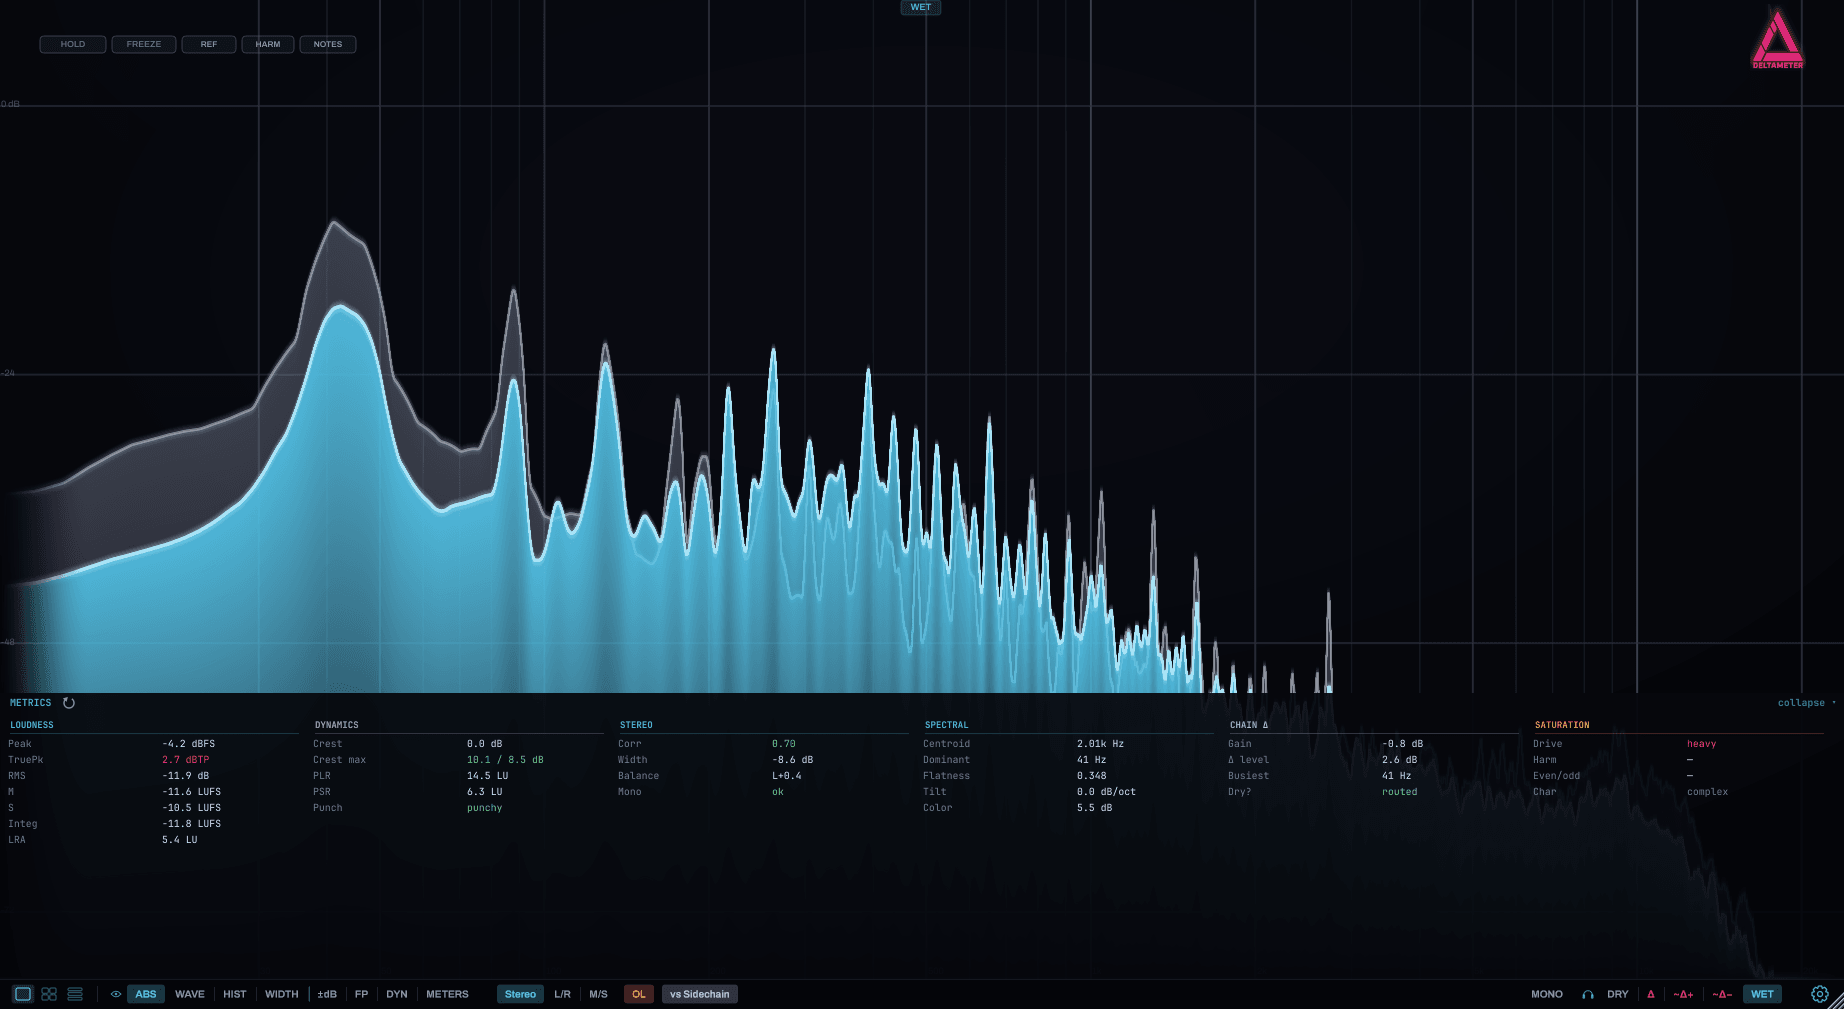
13 · Metrics HUD
Enable in Settings → Metrics HUD. A one‑line ticker along the bottom — click to expand into a five‑column dashboard:
- Loudness: Peak, True Peak (4× oversampled), RMS, Momentary/Short/Integrated LUFS, LRA.
- Dynamics: Crest, Crest max, PLR, PSR.
- Stereo: correlation, width, balance, mono‑risk, detected latency.
- Spectral: centroid, dominant freq, flatness, tilt, coloration.
- Chain Δ: overall gain change, Δ level, busiest band, latency, dry‑routed flag.
- Saturation: drive + harmonic character (even/odd, warm/harsh), from the delta.
A DC‑offset flag warns when the signal carries DC. Max‑hold values reset when playback starts, so each pass measures fresh; a ⟲ reset also clears the holds. Out‑of‑spec values turn red.
14 · Settings
Open the ⚙ cog (lower‑right). The panel is organized into five tabs — and it opens on the tab that matches your current view (WAVE/HIST → Wave/Hist, METERS → Meters, the spectral & transfer views → Spectrum).
Everything sticks. DeltaMeter reopens a project exactly as you left it — every editor‑local choice (view, zoom, HOLD/REF, dB ranges, freeze windows, multi‑view layout) is saved with the session, not just the automatable parameters.
GLOBAL
- Reactivity / Smoothness — display speed & smoothing.
- Stroke / Shading / Flat shading — curve thickness (slider = opacity), fill intensity, flat‑vs‑gradient body.
- GPU rendering / 60 fps refresh — smoother scopes on capable machines. Safe to leave on: at startup DeltaMeter tests its own shaders on your GPU; if the driver can't run them correctly it switches to software rendering automatically (one‑time notice, GPU info + Copy button here for support). 60 fps and Eco mode are mutually exclusive.
- Eco (low‑power) (off by default) — for weak laptops & quiet fans: caps the frame rate, drops anti‑aliasing, lightens the spectrum shader and trims the views, roughly halving CPU + GPU. Everything is untouched when it's off.
- Clicking the Δ logo switches last used: Preset / Monitor source / View (default Monitor source) — choose what the logo's one‑tap A/B flips between.
- Metrics HUD on/off, Stereo gestalt goniometer (ellipse vs. Lissajous), Reset tutorial.
SPECTRUM
- Spectral tilt — rotate the spectrum so a target slope reads flat.
- Constant‑Q smoothing — perceptual‑octave smoothing.
- ERB smoothing — smooth by the ear's own bandwidth (finer low, broader high).
- Equal‑loudness (A‑weighting) display — read "how loud it seems." Display‑only — never changes the LUFS numbers or the audio.
- Note reference (A4) — 440 / 432 / 415 Hz for the note/HARM/NOTES readouts.
- dB range — set the spectrum's vertical span by number (the same value as dragging the graph's left edge — they stay in sync).
- Peak‑hold decay — how fast a held peak falls back: Hold (∞) (latched, the default), 5 s, 3 s or 1 s.
- Distortion heat — a warm overlay showing where the chain added non‑linear / character content (saturation, clipping, grit) on the ABS, ±dB and FOOTPRINT views. Two modes: Mix (EQ‑robust — best for saturators/character) and Limiter (sensitive to limiting/clipping).
- Normalize delta to output — scales the audible delta monitor up to output level (a "delta listen"), so a quiet delta is easy to hear.
- Match wet to dry (delta) — before the delta is formed, gain‑match the wet to the dry so the difference shows what the chain did to tone and dynamics with the level change taken out. Two modes: RMS (a loudness‑matched A/B) and Makeup (limiter‑style — it stays silent while the chain isn't limiting, then reveals only the material a limiter/clipper removed once it clamps). Analysis & monitor only — the WET you hear and measure everywhere else is never altered.
- Sidechain align — a per‑instance sample offset (±100 ms, or type an exact value) with a live null‑residual readout, to dial out any dry‑vs‑wet misalignment your host's plugin‑delay‑compensation didn't handle. For the rare hosts that don't auto‑compensate sidechain latency.
- OSC output (off by default) — broadcast the spectrum / delta / loudness over OSC/UDP (localhost, configurable port) so an external visualizer — the included Max for Live mirror device, TouchDesigner, … — can render DeltaMeter with its window closed. It keeps the analysis running headless while enabled.
- 30 Hz saturation rolloff (off by default) — below ~30 Hz the analysis bins are very wide, so the meter can't reliably tell distortion from EQ or rumble down there. With this on, sub‑30 Hz heat is drawn faint white instead of confident yellow — it still shows, but reads honestly as "unsure." It's off by default on purpose: turning it on is a deliberate choice, so you've read why it exists. Real distortion's harmonics live higher up where the meter is fully confident, so you lose nothing important.
What the distortion read can — and can't — tell you. DeltaMeter shows what the chain did, not which plug‑in did it. The distortion heat flags any departure from a plain linear filter — saturation and clipping (its main use), but also time‑based effects: phasers, choruses, flangers, modulating filters and reverb. Those genuinely add time‑varying / uncorrelated content, so lighting them up is correct, not a false alarm — the tool just can't label what kind. To read harmonic saturation specifically, use Mix mode on a steady/tonal source.
WAVE/HIST
- Filled / detailed wave style, Seamless HIST scrolling. (WAVE's layout + tempo‑sync live in the bottom bar.)
- Wave colour — Channel (L green · R amber · Mid teal · Side magenta) or 3‑Band, a DJ‑style split of the waveform into low / mid / high frequency bands.
METERS
- Loudness meter on/off, metric + an independent rail metric, Show dry, target + platform presets, true‑peak ceiling, LU‑relative, Show scale, Big readout, calm readouts and wall mode — see §12 for the detail.
- Show crest factor in footprint — the dashed crest ceiling on the absolute footprint.
LICENSE
- Activate / deactivate your licence and see your activation status.

14b · Presets & workspaces
A preset bar sits at the top of the Settings panel: ◀ ▶ step through the list, and the name button opens a menu to Load · Save · Save As · Delete. A preset stores your whole look & analysis configuration — and the view (see below).
- User presets — save and recall your own named configurations. A
✱appears on the name when you have unsaved edits since loading it. - A/B compare — two slots; flip A ⇄ B to compare two complete configurations instantly. (The Δ logo, top‑right, is a different A/B — it flips your last two monitored sources.)
- A preset stores its VIEW — saving also captures the active workspace (which view, plus delta / channel mode / quad‑multi), so loading a preset snaps you straight back to that view. (Presets saved before this feature simply leave your current view untouched.)
Factory presets
Five built‑in, read‑only starting points (Save‑As one to keep your own copy). Each drops you into the right view and analysis state for the job:
| Preset | For | Lands on |
|---|---|---|
| Reference | flat & accurate — no tilt, weighting or smoothing | ±dB transfer |
| Mastering | perceptual + streaming target — ERB, equal‑loudness, +4.5 tilt, −14 LUFS / −1 dBTP, LU‑relative, calm | WET spectrum |
| Mixing | responsive — distortion‑heat on, short‑term meter | ±dB transfer |
| Saturation | harmonic forensics — distortion‑heat (Limiter) + Makeup wet‑match + normalized delta | ABS delta |
| Live / Wall | snappy, glanceable — Momentary, wall meters | METERS |
15 · Interaction cheat‑sheet
| Action | Result |
|---|---|
| Click graph | momentary band read / solo |
| ⌘/Ctrl‑click | latch a band (HARM/NOTES entry point) |
| Drag up/down on band | change Q (width) |
| Shift‑click | notch (hear everything except) |
| Right‑click‑hold | temporary readout crosshair (no audio) |
| Mouse‑wheel on latched band | arm / grow / disarm the harmonic series |
| Shift‑click a MONITOR source | audition it (eyes stay put) |
| Re‑click active source | flip to previous (A/B) |
| Click the Δ logo | A/B last two sources |
| Drag graph left edge | rescale (dB range / contrast) · double‑click resets |
| Alt‑drag on graph | measurement ruler (ΔdB/octaves · Δt + slope in DYN/WAVE) |
| Right‑click (ruler active) | clear the ruler |
| HOLD pill | HOLD → MAX → MAX·AVG |
| FREEZE pill (WAVE/ABS/DYN) | capture + scrub / hold (audible) |
| Double‑click FP body | reset running average |
16 · Workflows
- Is my limiter transparent? Monitor Δ; if you see/hear more than a whisper, it's doing more than you think.
- Read a compressor's real attack/release: comp before DeltaMeter, dry → sidechain, open DYN, drive it. FREEZE, then Alt‑drag the ruler down the attack ramp for the slope in dB/ms.
- Measure a transient's decay: FREEZE in WAVE, Alt‑drag across the tail.
- Find a chord: ⌘‑click the root, NOTES on, toggle 3·5·7·2, set MAJ/MIN/BOTH.
- Even vs odd saturation: ⌘‑click the fundamental, HARM, flip EVEN/ODD.
- Match tonal balance: ABS/WET, REF → Capture current on a reference track, match.
- Mono safety: WIDTH (watch for magenta wings) + MONO fold to hear the collapse.
- Whole‑mix masking: drop instances everywhere, Multi → MASK.
17 · Troubleshooting
- The delta views are empty / show only −wet. No dry reference is routed — send your pre‑FX signal to DeltaMeter's sidechain.
- Two overlaid (OL) waveforms don't line up. Use the WAVE offset trim to dial out the host's per‑track plugin‑delay compensation.
- The spectrum draws as garbage / cyan blocks. This shouldn't happen anymore — DeltaMeter probes your GPU at startup and falls back to software rendering by itself. If you ever see it, grab Settings → Copy (GPU info) and the
gpu.logfrom your app‑data folder and send them over. - Scopes don't scroll. WAVE / DYN / HIST advance whenever audio is flowing and hold on silence — so play, or arm + monitor the track. If nothing moves, no audio is reaching the insert.
- The peak meter clips, but no spectrum band is anywhere near 0 dB. Both are telling the truth — they answer different questions. A time‑domain peak is every frequency component summing at one instant: thousands of bands each at −25 dB can stack to 0 dBFS at a single sample (a full‑scale sine reads 0 dB in its band; a full‑scale mix never does, because its energy is spread across ten octaves). And the spectrum averages over its analysis window (~an eighth of a second), so a millisecond transient that pins the true‑peak meter barely registers in any band. The gap between the two is itself useful: large gap = transient‑rich / wideband material, small gap = tonal or heavily limited.
DeltaMeter — see the difference, hear the difference. 🖤